对于进度环,可以用仪表板实现,但还要渐变虚线就有点麻烦了。最终结果如下图。
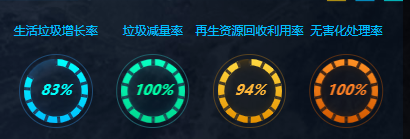
四个环,四个 echarts 实例。环外圈的边框用 div 实现,环的渐变背景用图片实现。然后渐变虚线环和中间文字使用 echarts 实现。
渐变虚线环需要两个 gauge 图表实现,一个用 progress 实现进度,一个实现刻度。刻度需要注意,不能铺满 360°,否则背景上出现刻度很突兀。所以刻度的范围和数量是根据进度计算出来的。
const list = [
  {
    name: '生活垃圾增长率',
    color: [
      'rgba(0, 255, 251, 1)',
      'rgba(0, 192, 255, 1)',
      'rgba(0, 255, 251, 1)',
      '#1f4a73',
      '#1f3249',
    ],
  },
  {
    name: '垃圾减量率',
    color: [
      'rgba(8, 255, 194, 1)',
      'rgba(0, 216, 142, 1)',
      'rgba(0, 255, 168, 1)',
      '#1e5d67',
      '#183441',
    ],
  },
  {
    name: '再生资源回收利用率',
    color: [
      'rgba(255, 217, 66, 1)',
      'rgba(229, 145, 0, 1)',
      'rgba(255, 182, 56, 1)',
      '#554120',
      '#2e2d2b',
    ],
  },
  {
    name: '无害化处理率',
    color: [
      'rgba(255, 145, 37, 1)',
      'rgba(209, 88, 0, 1)',
      'rgba(255, 129, 37, 1)',
      '#572e13',
      '#1f191b',
    ],
  },
].map((item, index) => {
  const temp = {
    ...item,
    percent: combineData[index]?.value2 || 0,
    bg: `./images/board/operation/${item.name}.png`,
    option: {
      tooltip: {
        formatter: '{a} <br/>{b} : {c}%',
      },

      grid: {
        left: 0,
        right: 0,
        top: 0,
        bottom: 0,
      },

      series: [
        {
          name: '进度条',
          type: 'gauge',
          center: ['50%', '50%'],
          radius: '100%',
          z: 1,
          startAngle: 90,
          endAngle: -269.999,
          progress: {
            show: true,
            width: 8 * window.widthScale,
            zlevel: 1,
            itemStyle: {
              color: {
                type: 'linear',
                x: 0,
                y: 1,
                x2: 0,
                y2: 0,
                colorStops: [
                  {
                    offset: 0,
                    color: item.color[1],
                  },
                  {
                    offset: 1,
                    color: item.color[0],
                  },
                ],
                global: false, // 缺省为 false
              },
            },
          },
          axisLine: {
            show: false,
          },
          axisLabel: {
            show: false,
          },
          axisTick: {
            show: false,
          },
          splitLine: {
            show: false,
          },
          itemStyle: {
            show: false,
          },
          data: [
            {
              value: combineData[index]?.value1 ?? 0,
            },
          ],
          pointer: {
            show: false,
          },
          detail: {
            color: item.color[2],
            fontStyle: 'italic',
            fontSize: 18 * window.widthScale,
            offsetCenter: [0, 0],
            formatter: (value: number) =>
              `${VtxRegex.isEmpty(value) ? 0 : Math.round(value)}%`,
          },
        },
        {
          name: '刻度',
          type: 'gauge',
          center: ['50%', '50%'],
          radius: '100%',
          z: 2,
          startAngle: 90,
          endAngle: -(
            (359.999 * (combineData[index]?.value1 ?? 0)) / 100 -
            90
          ), // 截止到进度条位置,避免非进度条位置出现刻度
          splitNumber: Math.round(
            (14 * (combineData[index]?.value1 ?? 0)) / 100,
          ), // 根据进度条计算出大致刻痕数量,尽量稀疏一致
          axisLine: {
            show: true,
            lineStyle: {
              // 因为刻度的 distance 是相对于轴线定位的,所以轴线需要显示,但是不能有颜色。
              color: [[1, 'transparent']],
              width: 8 * window.widthScale,
            },
          },
          axisLabel: {
            show: false,
          },
          axisTick: {
            show: false,
          },
          splitLine: {
            show: true,
            lineStyle: {
              // color: '#101925',
              color: {
                type: 'radial',
                x: 0.5,
                y: 0.5,
                r: 0.5,
                colorStops: [
                  {
                    offset: 0,
                    color: item.color[3], // 0% 处的颜色
                  },
                  {
                    offset: 1,
                    color: item.color[4], // 100% 处的颜色
                  },
                ],
                global: false, // 缺省为 false
              },
            },
            length: 8 * window.widthScale,
            distance: -8 * window.widthScale,
          },
          itemStyle: {
            show: false,
          },
          pointer: {
            show: false,
          },
        },
      ],
    },
  }

  return temp
})
~~我不想画图了~~